The short answer
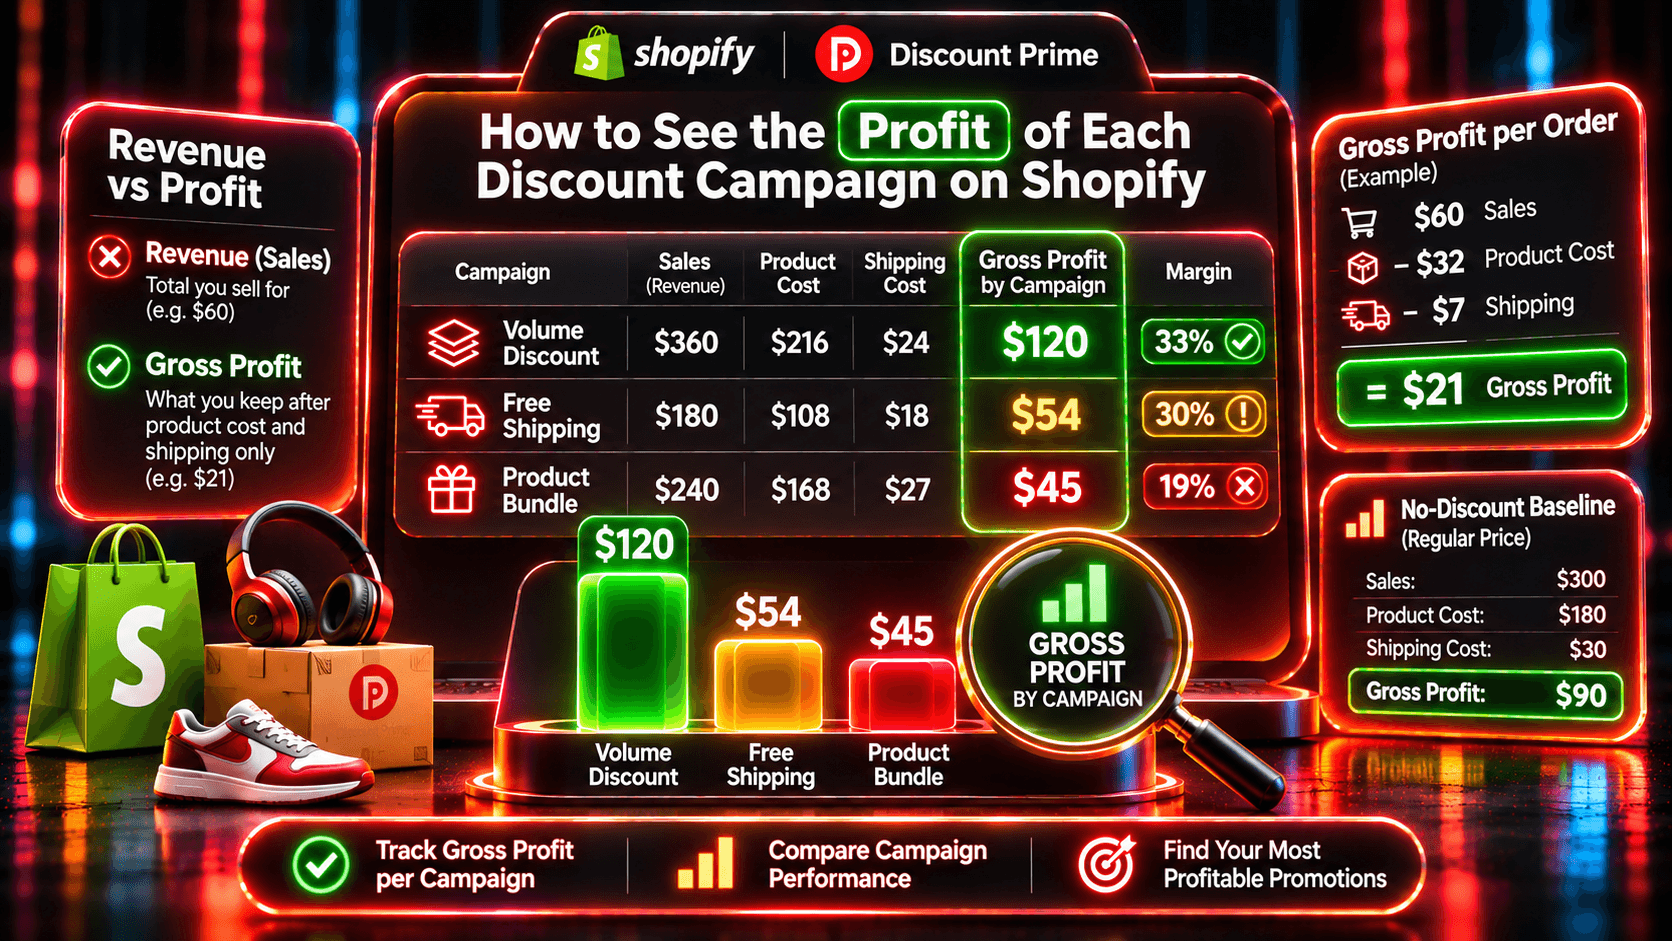
To see which Shopify discount made money, you need cost next to each campaign, and Shopify's own reports split the two: sales by discount in one report, gross profit by product, variant, and order in another. Discount Prime puts them together: its profit analytics, free on every plan including Starter, show gross profit per campaign and per order from your Shopify cost prices and shipping, so the campaign and its profit sit in the same place.
Be clear about the limits. Discount Prime reports gross profit after product cost and shipping, and it covers Discount Prime campaigns only. Payment fees and ad spend aren't included, and Shopify codes are measured in Shopify's reports. Profit analytics apps cover fees and ad spend store-wide.
App | Rating · Reviews | Price | What it shows for discounts | Keep in mind |
|---|---|---|---|---|
Discount Prime | 5.0 · 20 | Free on Starter; paid plans from $19.90/mo | Gross profit per campaign and per order, margin health, revenue against a no-discount baseline, discount ROI | Discount Prime campaigns only. No payment fees or ad spend |
Shopify reports | Built in | $0 | Sales by discount codes (no cost), and gross profit by product, variant and order (no campaign) | You join the two yourself. Only items with a Cost per item count |
TrueProfit | 4.9 · 928 | About $35 to $200/mo, plus a fee per extra order | Store-wide profit after COGS, shipping, transaction fees, taxes and ad spend | The listing doesn't mention profit per discount |
BeProfit | 4.5 · 203 | Free; about $29 to $149/mo | Contribution profit on every order and product, after product costs, ad spend, shipping, fees and refunds | The listing doesn't mention profit per discount |
Lifetimely | 4.9 · 623 | Free; about $49 to $299/mo | P&L with net profit, COGS, ad spend and discounts as a line, plus lifetime value | Discounts are one P&L line, not per campaign |
Ratings, reviews, and prices from each app's Shopify App Store listing, as of November 2026. Rival prices were shown in CAD from our location and were converted to USD at the listing's rate. Disclosure: Discount Prime is our app.
We did not install the rival apps. Their rows come from their listing text only.
Which one fits:
You want to know if the business is profitable after ads and fees: TrueProfit, BeProfit, or Lifetimely
You want profit per order with every cost line shown: BeProfit
You run a few Shopify codes and are happy with a spreadsheet: Shopify's two reports, joined by hand
You want to compare discount campaigns with each other, next to the campaigns themselves, for free: Discount Prime, which also works alongside a profit app
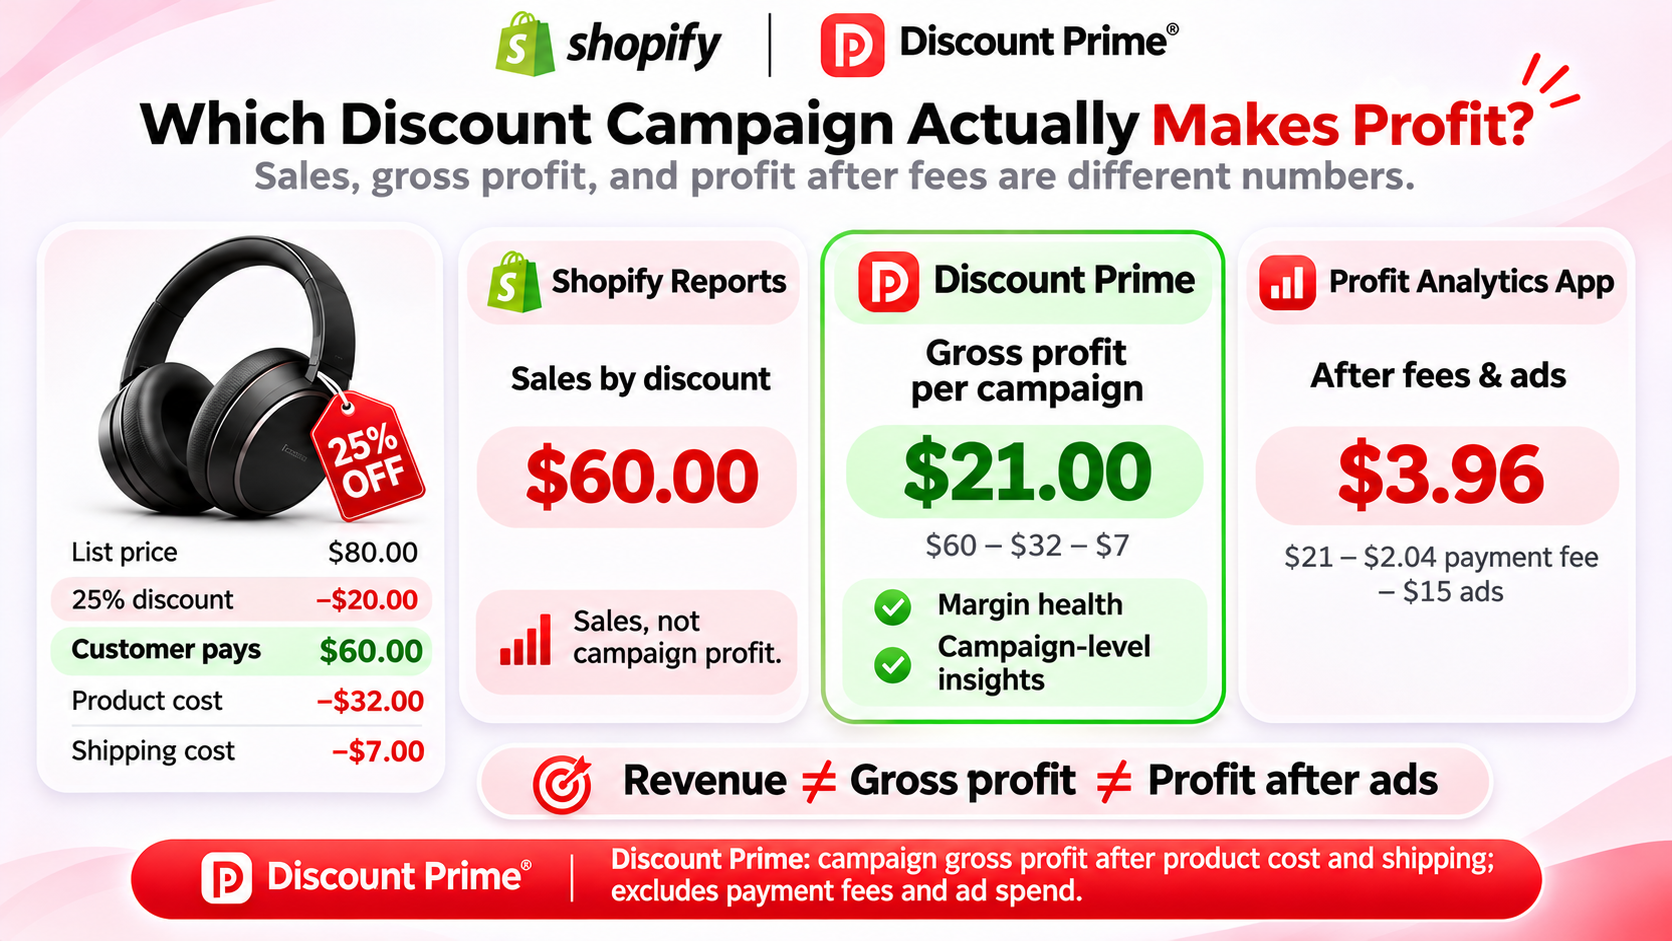
One order, read three ways
A product sells for $80 and costs $32. A customer buys it during a 25% off Discount Prime campaign, so the product line is $60.00. Shipping is free to the customer, and you pay $7 to ship it. You spent about $15 on ads per order that month, and the card fee is 2.9% plus 30 cents.
What you read | Where | The number |
|---|---|---|
Sales for that discount | Shopify, Sales by discount codes | $60.00 |
Gross profit after product cost and shipping | Discount Prime profit analytics | $21.00 ($60.00 - $32.00 - $7.00) |
Profit after fees and ads | A profit analytics app | $3.96 ($21.00 - $2.04 fee - $15.00 ads) |
At full price, the same order would have earned $41.00 of gross profit. The discount cost $20.00, and the shipping you covered cost $7.00 more.
Each number answers a different question. The sales figure says what the discount sold. Gross profit says what the campaign earned before overhead, which is the number you need to compare one campaign with another. Profit after fees and ads says whether the order paid for its customer. You can check the gross profit line in the Discount Profit Calculator.
What Shopify shows on its own
Sales by discount codes (Analytics > Reports) groups sales by discount name, automatic discount, or code, with the discount amount, orders, and total sales. It has no cost or profit column.
Profit reports (Analytics > Reports, category Profit Margin) show gross profit by product, by variant, by POS location, by market, and by order. Profit is counted only for items that had a Cost per item when they sold.
Discounts and refunds lower net sales and margin in the profit reports. Shopify's own example: a $20 T-shirt that costs $10 shows a 50% margin, and the same shirt sold at $15 shows 33%.
So you can see a margin drop during a sale, but not which campaign caused it. To get profit per campaign, you export both reports and join them yourself, which gets hard when discounts combine on one order. See Shopify's profit reports help page.
What profit analytics apps show
Profit apps pull costs, fees, shipping, and ad spend from many sources into one store-wide profit figure. That is the right tool when your question is "is the business profitable after ads?"
They are built around the store, the order, the product, and the ad channel. Check what each listing says about discounts before you rely on it for campaign decisions. None of the three listings we read, TrueProfit, BeProfit, and Lifetimely, state profit per discount code. Lifetimely lists discounts as a line in its P&L, and BeProfit shows contribution profit per order and product.
What Discount Prime shows
Discount Prime's profit analytics sit next to the campaigns themselves:
Gross profit per campaign and per order, from Shopify cost prices that sync daily, with shipping counted separately from product revenue.
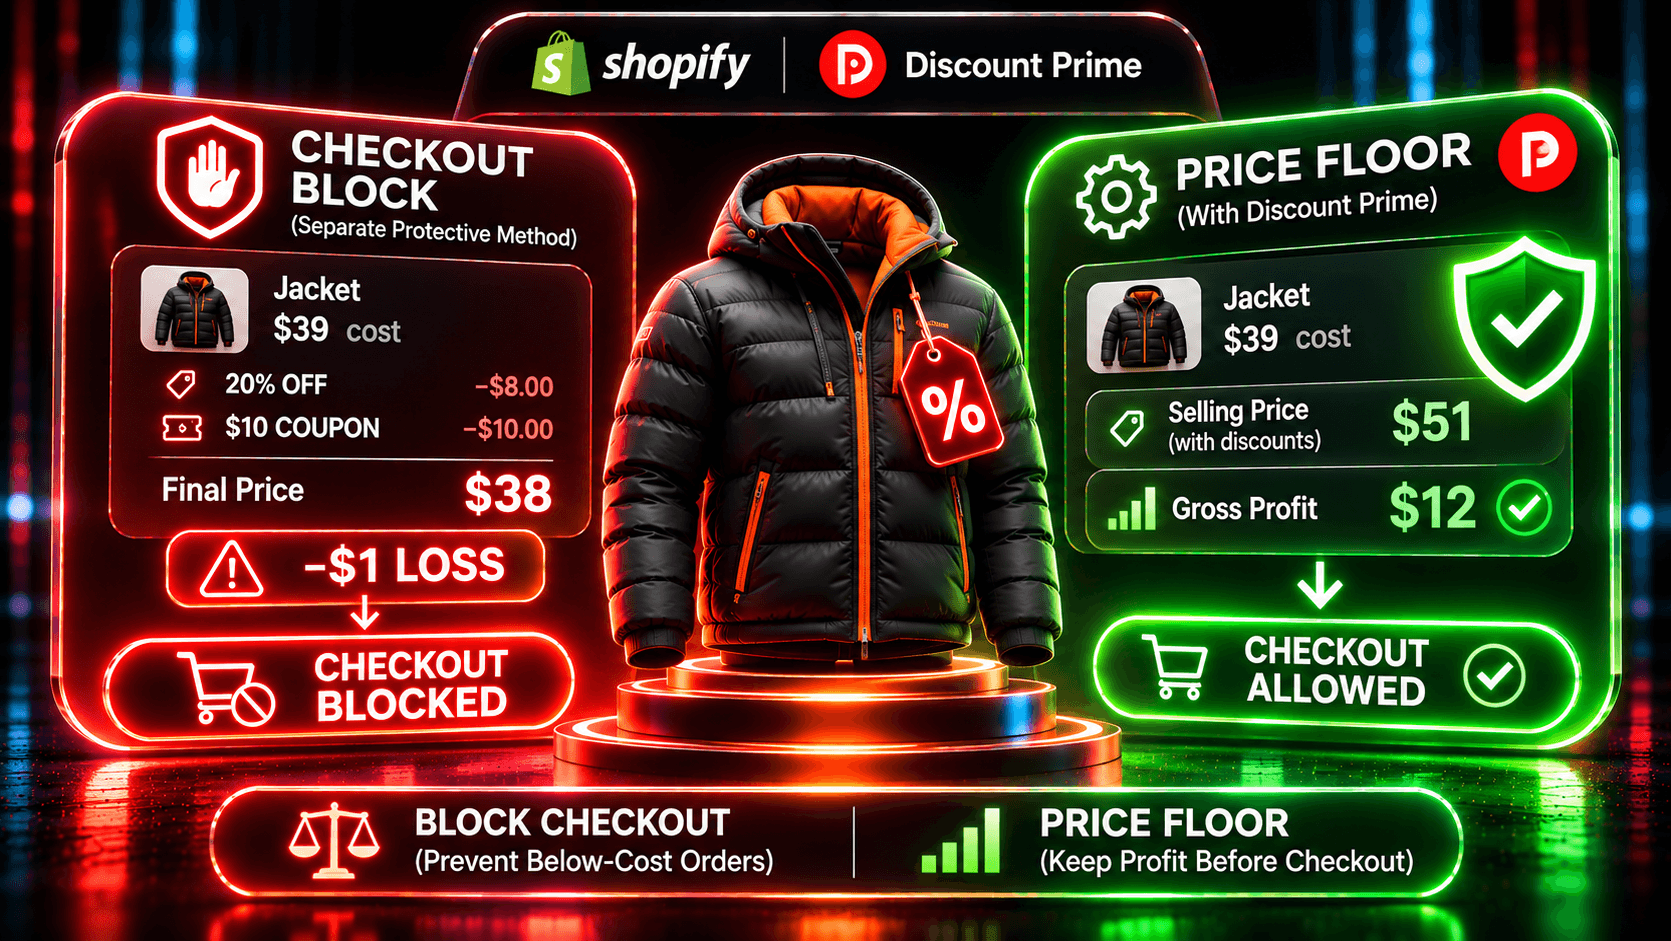
Margin health per campaign: Loss below 0% margin, Thin below 20%, Healthy at 20% or above.
Revenue against a no-discount baseline, charted per day, so you see whether the campaign added anything.
Discount ROI and shipping promotion ROI, discounted orders, AOV uplift, and the total discount given.
Profit analytics are on every plan, including the free Starter plan. Payment fees aren't deducted, and ad spend isn't included. Read the figure as gross profit after product cost and shipping.
Two case studies show it in use: discount analytics that explain every order and margin health alerts for Shopify promotions.
Get clean numbers per campaign
Profit per campaign is only as clean as your campaign setup.
Fill in Cost per item for every variant. Shopify's profit reports leave out items with no cost when they sold, so a missing cost creates a gap in every report built on it.
Run each offer as its own campaign, so each one gets its own line.
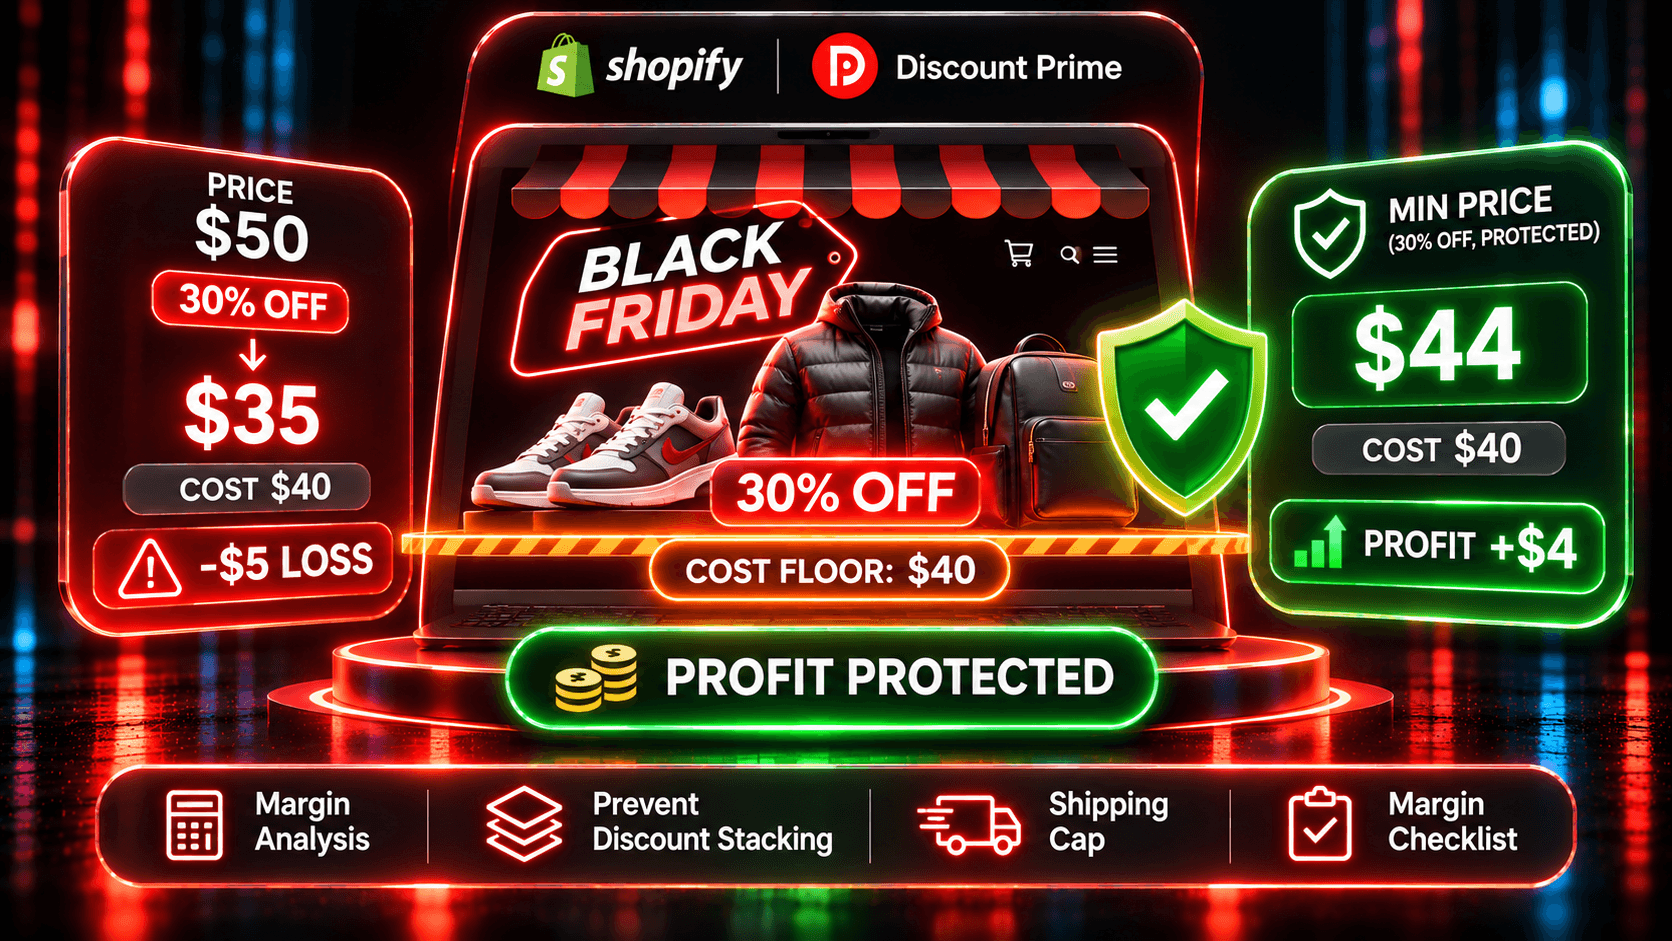
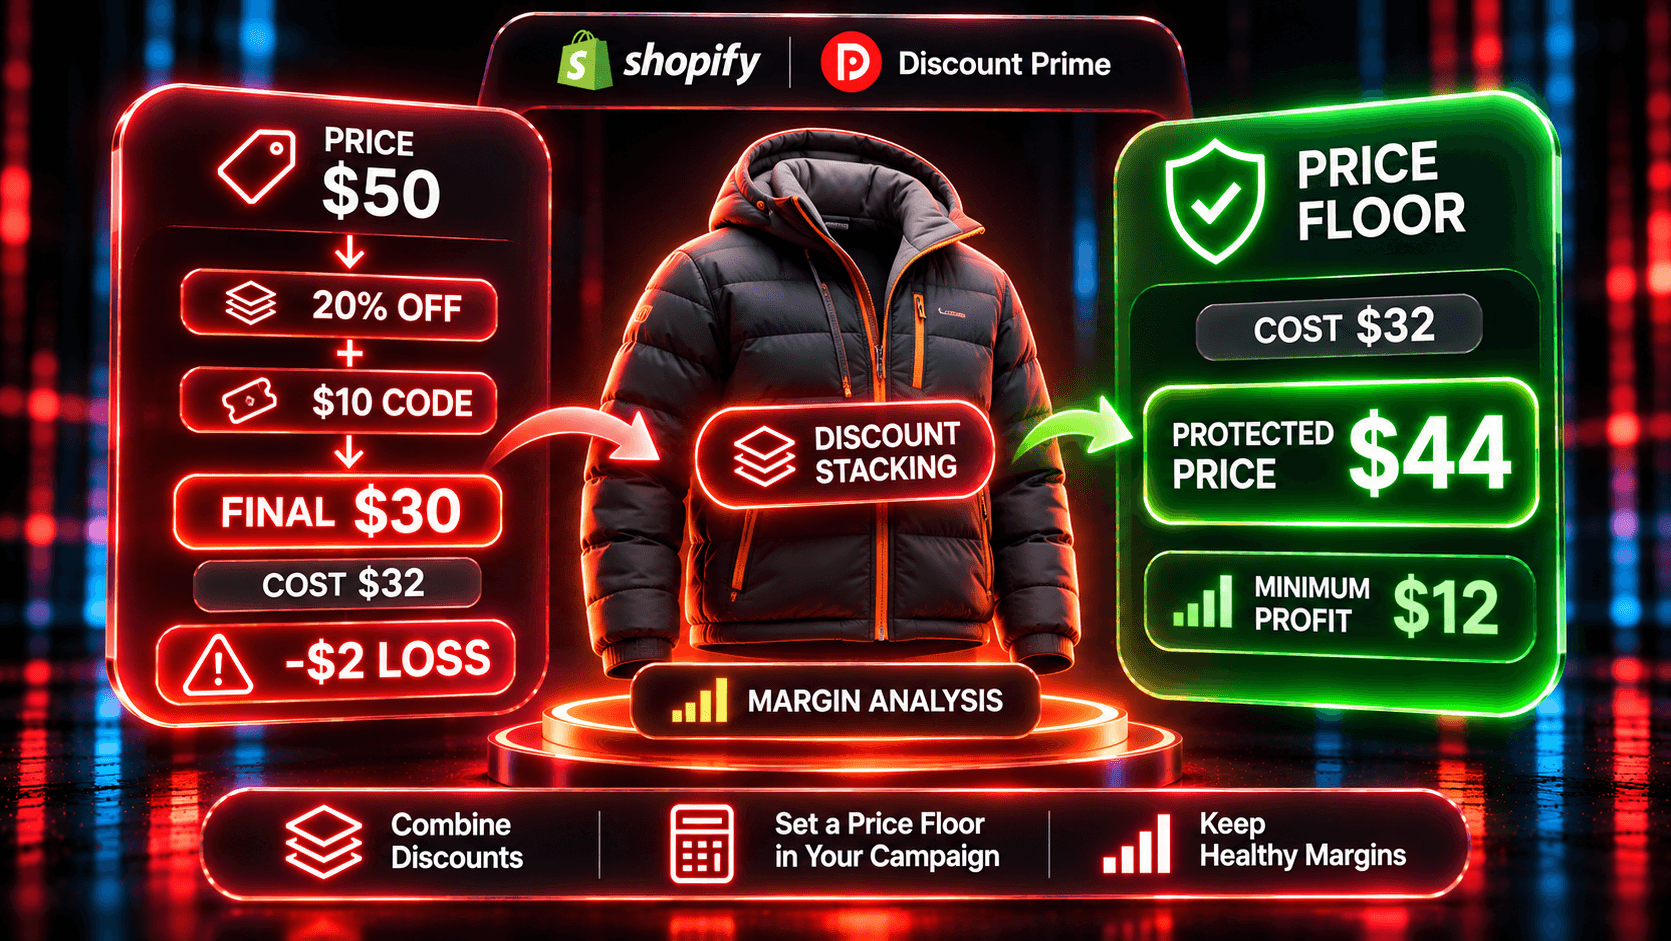
Keep one price campaign per product at a time. Discount Prime's conflict detection flags product-level price campaigns that target the same product. When two discounts land on one order, the second one's value depends on the first, and per-campaign totals overlap.
Note a baseline period before launch: dates, orders, revenue, and gross profit.
Measure Shopify codes separately in Sales by discount codes, since they follow Shopify's combination settings.
For the metrics and a full worked comparison of two campaigns, see how to measure the profit of a Shopify promotion. For why revenue alone misleads, see GMV is a vanity metric.
How to set it up in Discount Prime
Install Discount Prime on Starter (free).
Check Cost per item in Shopify for the products you discount. Costs sync to the app daily.
Create your campaigns in the app. Starter includes 3 campaigns. Premium ($19.90/month, 7-day free trial) includes 10, and Prime ($49.90/month, 7-day free trial) includes 30.
Open Profit Analytics after the first week. Sort campaigns by margin health and compare gross profit with your baseline.
Before the next campaign, test the offer in the Discount Profit Calculator and check the break-even discount.
Where to go next
What is the biggest discount you can give without losing money?: the break-even formula and the extra orders a discount needs
How to measure the profit of a Shopify promotion: five metrics and a baseline
Profit Analytics: every metric, with admin screenshots
Discount Profit Calculator: check an offer before you launch it
Ready to try it? Install Discount Prime from the Shopify App Store. Profit analytics are free on the Starter plan.