Every discount dashboard celebrates revenue uplift. Most of that uplift is dollars you lost on margin you never measured.
This is the fourth article in The Agentic Commerce Playbook for Shopify Merchants. The first three articles covered how to reach agents and how to design offers that work for them. This one pivots inward, to the question that should govern every campaign you run, regardless of channel: are you actually making money on it?
The honest answer, for most stores, is that they do not know. Their discount dashboards report GMV lift, orders affected, and discount amount issued, none of which answer the question. A 15% GMV lift can be a successful campaign or a disaster, depending on the mix of products discounted, the margin on each, and the cannibalization of full-price sales. The dashboards do not distinguish.
Why GMV lift is the default, and why that is wrong
GMV is the default metric because it is the easiest to compute. Shopify knows the order total; it reports the order total; the discount app surfaces the difference with and without the campaign. No additional data is needed. No merchant setup. It works on every store, which is precisely why it is the default.
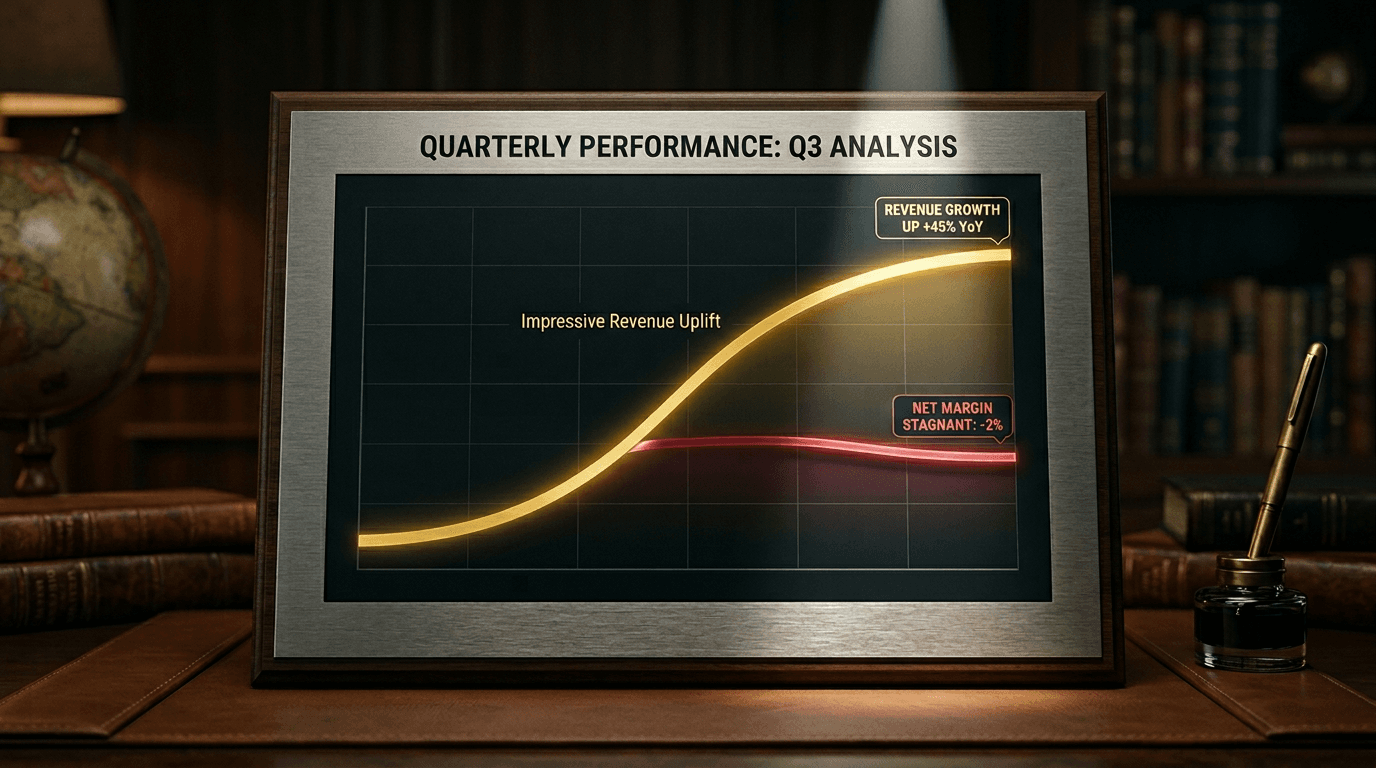
But GMV is a top-line number, not a health number. A campaign that lifts GMV 15% while compressing margin from 42% to 29% has destroyed contribution margin in absolute terms. The store made less money on more revenue. That outcome is invisible in any report that looks only at GMV. The merchant walks away from the dashboard satisfied, schedules the next campaign, and the same pattern repeats until the quarterly P&L arrives and nobody can explain why it is soft.
The math that turns a 12% lift into a 4% margin loss
Consider a concrete example. A store sells a $100 product with a $60 cost (a 40% margin). It runs a 20% off campaign. GMV for this SKU lifts by 12% because the discount drove incremental volume. The report shows green. The actual math: each sale at $80 with a $60 cost contributes $20 in gross margin, versus $40 at full price. The 12% volume lift would need to be 100% to hold gross margin constant. A 12% lift leaves the store with less absolute margin than before, despite the apparent GMV gain. The campaign lost money on the metric that matters.
The specific numbers vary. The pattern does not. Across a sufficiently large set of campaigns, the difference between GMV-reported success and margin-reported success is systematically negative. Merchants running many campaigns without margin reporting are, on average, running slightly loss-making promotional programs. They are doing it in a mood of incremental optimism, produced by a dashboard that answers a different question than the one the business cares about.
The 80/20 path to getting cost-price data in
The obvious objection is that margin reporting requires cost-price data, and most merchants do not have cost prices entered for every SKU. This is true, and it is exactly why most discount dashboards do not offer the feature. But the practical truth is that merchants do not need cost prices on every SKU to get actionable margin reporting. They need the cost of the top 20% of SKUs by revenue, which, for most stores, is over 80% of the campaign impact.
The setup path is straightforward. Export your top 100 SKUs by revenue for the last quarter and enter cost prices for those (a single afternoon of work, usually). For the long tail, use category-default margins as a placeholder. Margin reports flag which categories matter and which are noise. Over the next quarter, fill in the top 500 SKUs. Inside six months, the store will have meaningful cost coverage for every campaign it is likely to run. The work is small. It is simply not a default.
What a profit-first campaign report actually shows
When a campaign report includes margins, the shape of the information changes. GMV lift becomes one number among several, and not the most important. The hero number becomes absolute contribution margin, or margin percentage, or margin-per-order, depending on the merchant's priority. The report shows which SKUs lifted profitably and which destroyed margin. It flags campaigns where the GMV gain came from a narrow set of SKUs at the expense of others through cannibalization.
This kind of report produces different decisions. A campaign with 15% GMV lift but flat margin becomes a campaign to refine, not to repeat. A campaign with 3% GMV lift and 8% margin lift (possible through tight product selection) becomes a winner worth scaling. These are the judgment calls that separate operators who compound from operators who spin.
The one number that should be at the top of your dashboard
If you have to choose one metric for the top of your discount dashboard, the right one is campaign-level incremental contribution margin in dollars. It is the purest expression of whether the campaign made the business money. Every other metric feeds into it or distracts from it.
The shift is not primarily technical. It is cultural. Most merchants have been trained by a decade of dashboards to accept "GMV lifted" as sufficient evidence of success. Breaking that habit, in the merchant's own head and in the merchant's tooling, is the first concrete step of a profit-first discount program. The rest of this series, and much of what separates serious discount operators from casual ones, depends on this one shift. If your report still celebrates GMV without showing margin, it is the wrong report.
Part 4 of 9 of The Agentic Commerce Playbook for Shopify Merchants. Each article in the series stands on its own, but is designed to be read in sequence.
Related on Discount Prime: Profit analytics · Best Shopify discount apps