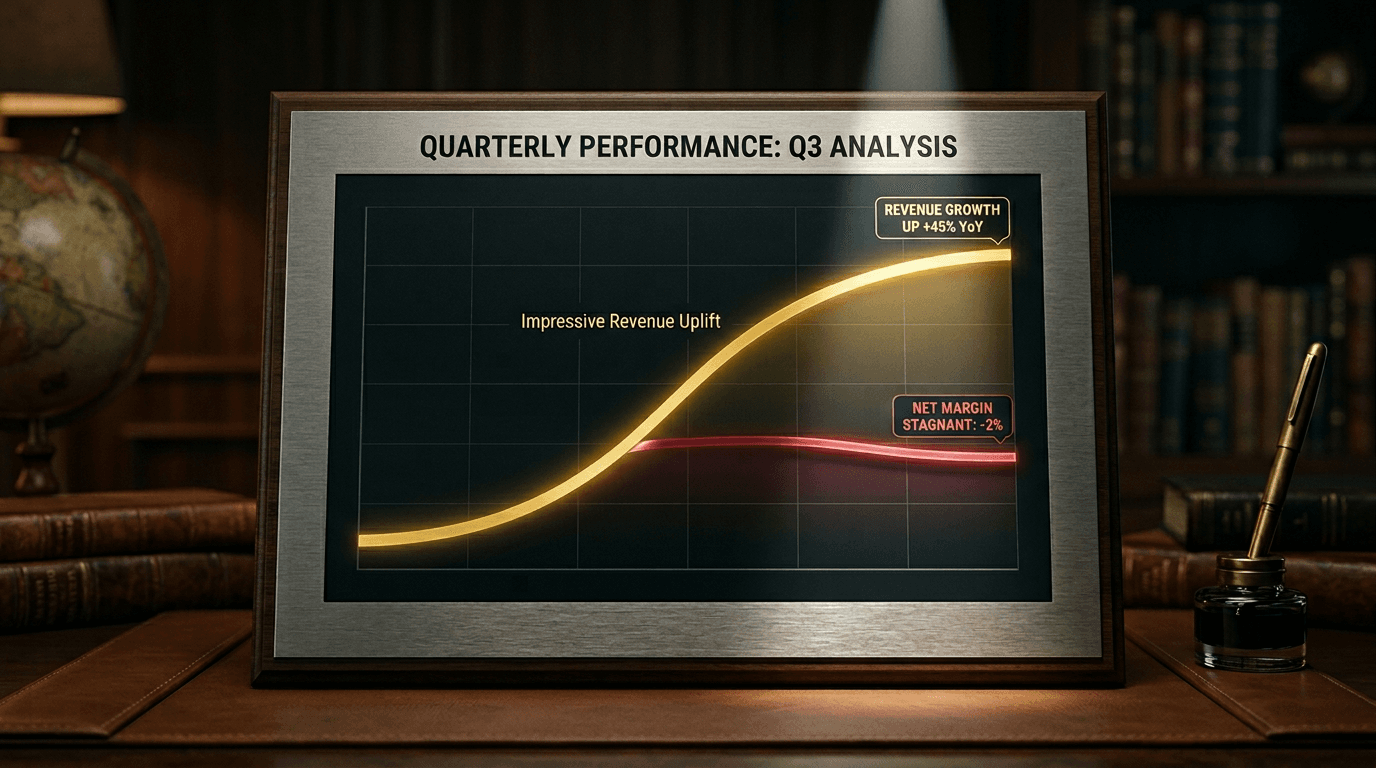
Revenue tells you a discount sold something. It does not tell you the discount earned anything. Those are different questions, and most stores only ever get the first answer.
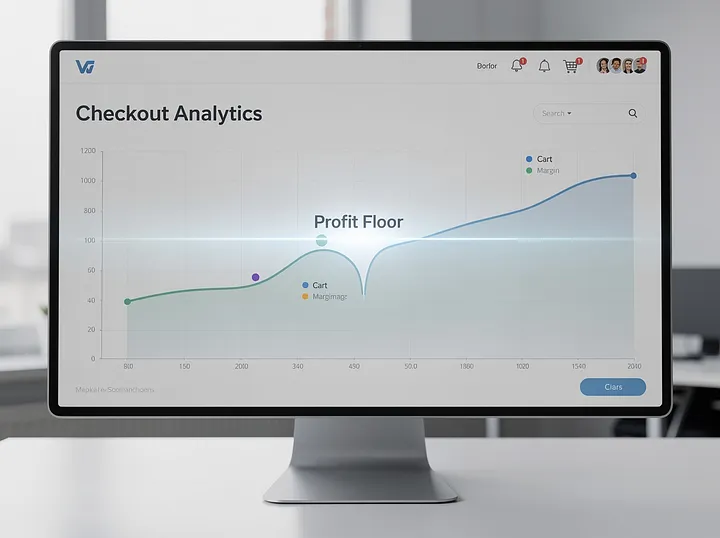
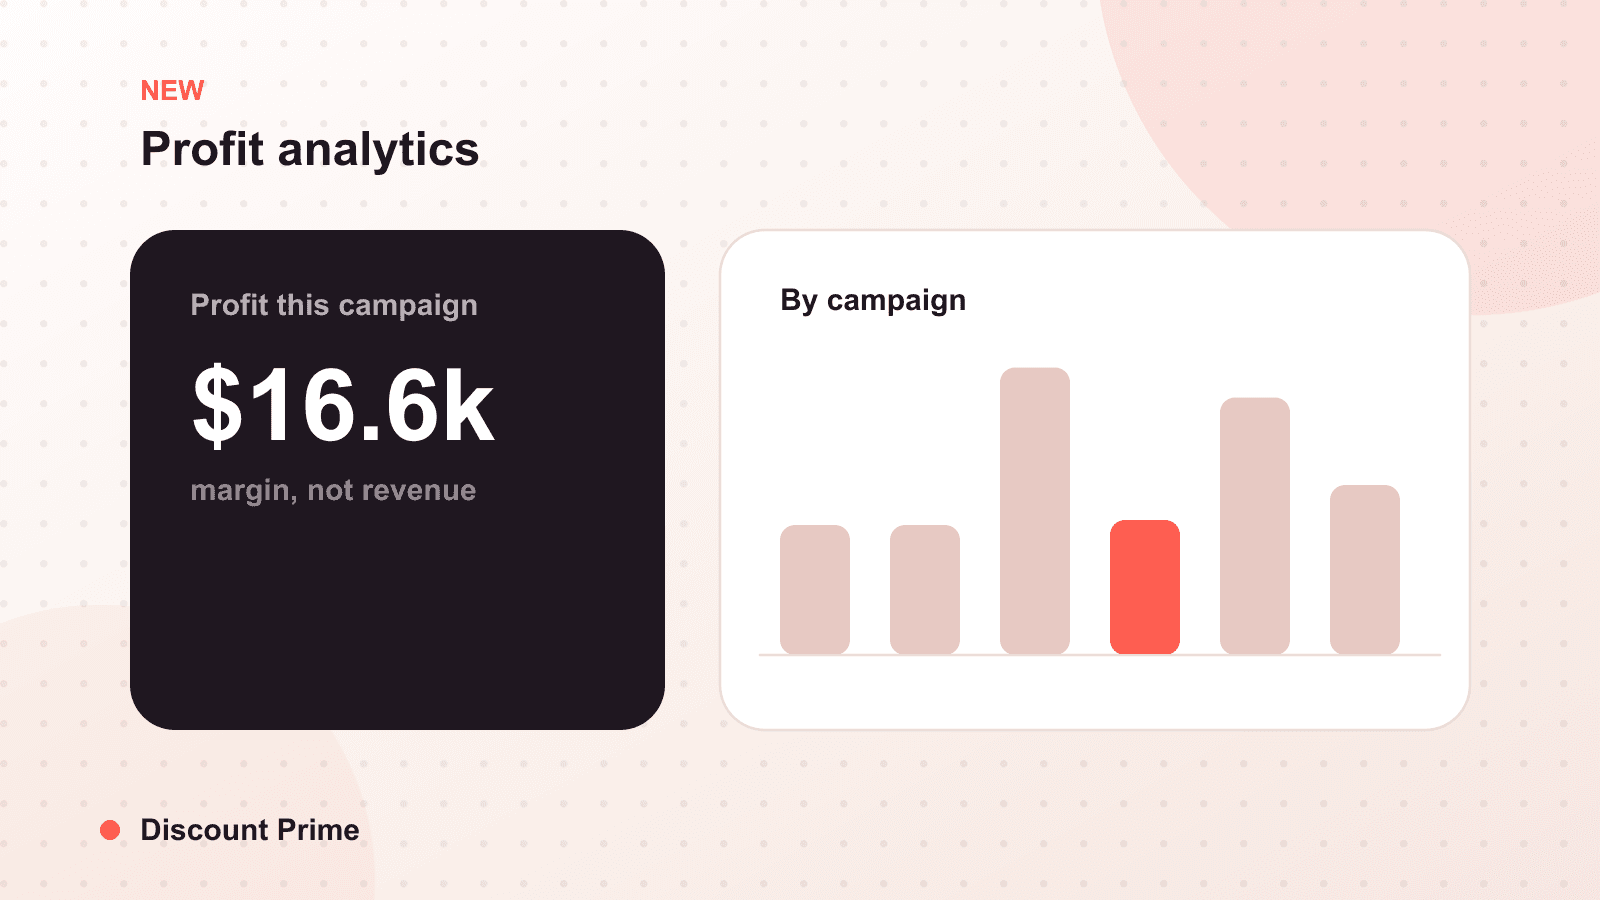
Today Discount Prime ships profit analytics. Every discount campaign now gets a margin number, not just a revenue number. You can finally tell, at a glance, which of your promotions made money and which ones just moved volume while quietly losing it. This is the feature we have been building toward since the day we launched, and it is the one that changes how you should read every campaign you run.
Here is the plain version of what it does: you add a cost for each product once, and Discount Prime subtracts that cost and the discount from each order to show the gross margin a campaign actually left behind. Revenue reporting is table stakes. Margin is the story.
Why revenue is the wrong headline
Revenue is the number every reporting tool leads with, because it is easy to calculate and it always goes up when you discount harder. That is exactly the problem. A promotion can top your revenue chart and still lose money on every single order, once you subtract what the product cost and what you gave away.
Consider two campaigns that each generated $10,000 in sales. Campaign A was 10% off a product line with 55% margins. Campaign B was 40% off a clearance line with 30% margins. Same revenue. Judged on revenue, they look identical, and you would happily run both again. Judged on margin, one funded your business and the other drained it. If your dashboard only shows revenue, you cannot see the difference, so you keep repeating the expensive one.
What "margin, not just revenue" actually means
Gross margin is what is left after the cost of the goods and the discount come out of the sale price. It is the money that can actually pay for your ads, your team, and your rent. Revenue cannot do any of that; only margin can.
Profit analytics closes the gap in three steps:
1. You enter cost once per product. Add a cost of goods figure to each product. Every campaign that touches that product inherits the number automatically, so you do it once, not per promotion.
2. Every campaign gets a profit number. For each discount, Discount Prime subtracts product cost and the applied discount from order revenue and attributes the result to the campaign that drove it. You now see profit per promotion sitting right next to the revenue you were already watching.
3. You compare promotions on margin. With a profit number on every campaign, ranking your discounts by what they earned instead of what they sold takes seconds. The promotions that survive that ranking are the ones worth repeating.
A worked example
Say a volume tier moved 500 units at $18 each, for $9,000 in revenue. The revenue view stops there and calls it a success. Now add the cost data. Each unit costs you $11, and the tier discount averaged $2 per unit off the $20 list. Your margin per unit is $18 minus $11, or $7, across 500 units, which is $3,500 of gross margin. That is the real result. If instead your cost had been $15 per unit, the same $9,000 campaign would have left just $1,500 of margin, and a slightly deeper tier would have tipped it negative. Same revenue headline, completely different verdict. That is the number you could not see before today.
This is the second half of a plan
When we shipped discount analytics in September, we said it was the first step, not the destination. Discount analytics answered "which discounts drove sales and how were they used." Profit analytics answers the harder question sitting underneath: "which of them actually earned." You need both. A promotion that sold well and earned nothing is not a win, it is a lesson, and now you can see it as one.
This matters most for stores with thin margins to begin with. If you dropship or resell, the gap between revenue and profit is where your entire business lives, and running discounts without seeing margin is flying blind over a very short runway. Cost-aware pricing is where this leads next, and it is why we built our dropshipper pricing page around the same idea. Getting your cost data in now sets you up for everything on that path.
What to do with it this week
Start by entering costs for your top products, then look back at the promotions you ran over the holidays. Rank them by margin instead of revenue. Most merchants find at least one campaign they were proud of that turns out to have earned far less than a quieter one, and at least one they nearly cut that was actually their best. That single reordering is the point of the feature.
Then set a break-even discount for each product line, meaning the depth at which margin hits zero, and never let a tier cross it. With cost data in place, that line is now visible instead of theoretical.
Setting this up with Discount Prime
Profit analytics is live now for every Discount Prime store. Add your product costs, and every campaign you run from here on gets measured by what it earned, not just what it sold. It runs on the same Shopify Functions foundation as the rest of the app, on any plan, so your volume discounts and your reporting speak the same language. Next up in this series, we go deep on getting cost data right in COGS on Shopify. You can find the app on the Shopify App Store.