You cannot manage what you cannot see, and until now most Shopify stores have run their discounts with the lights off.
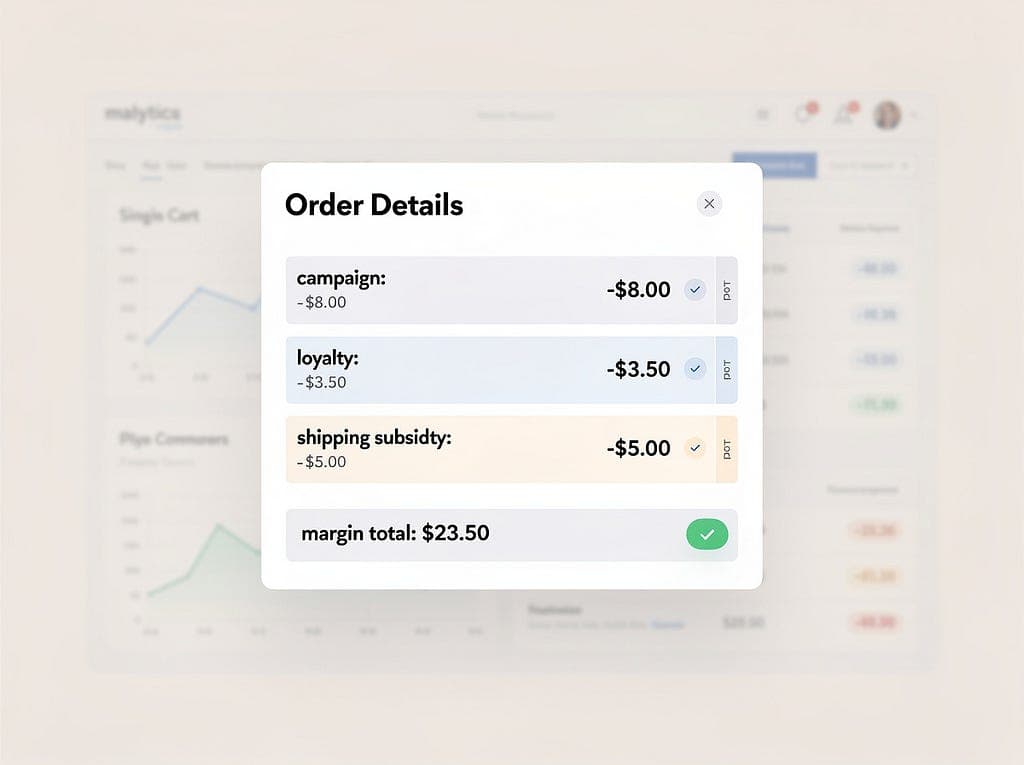
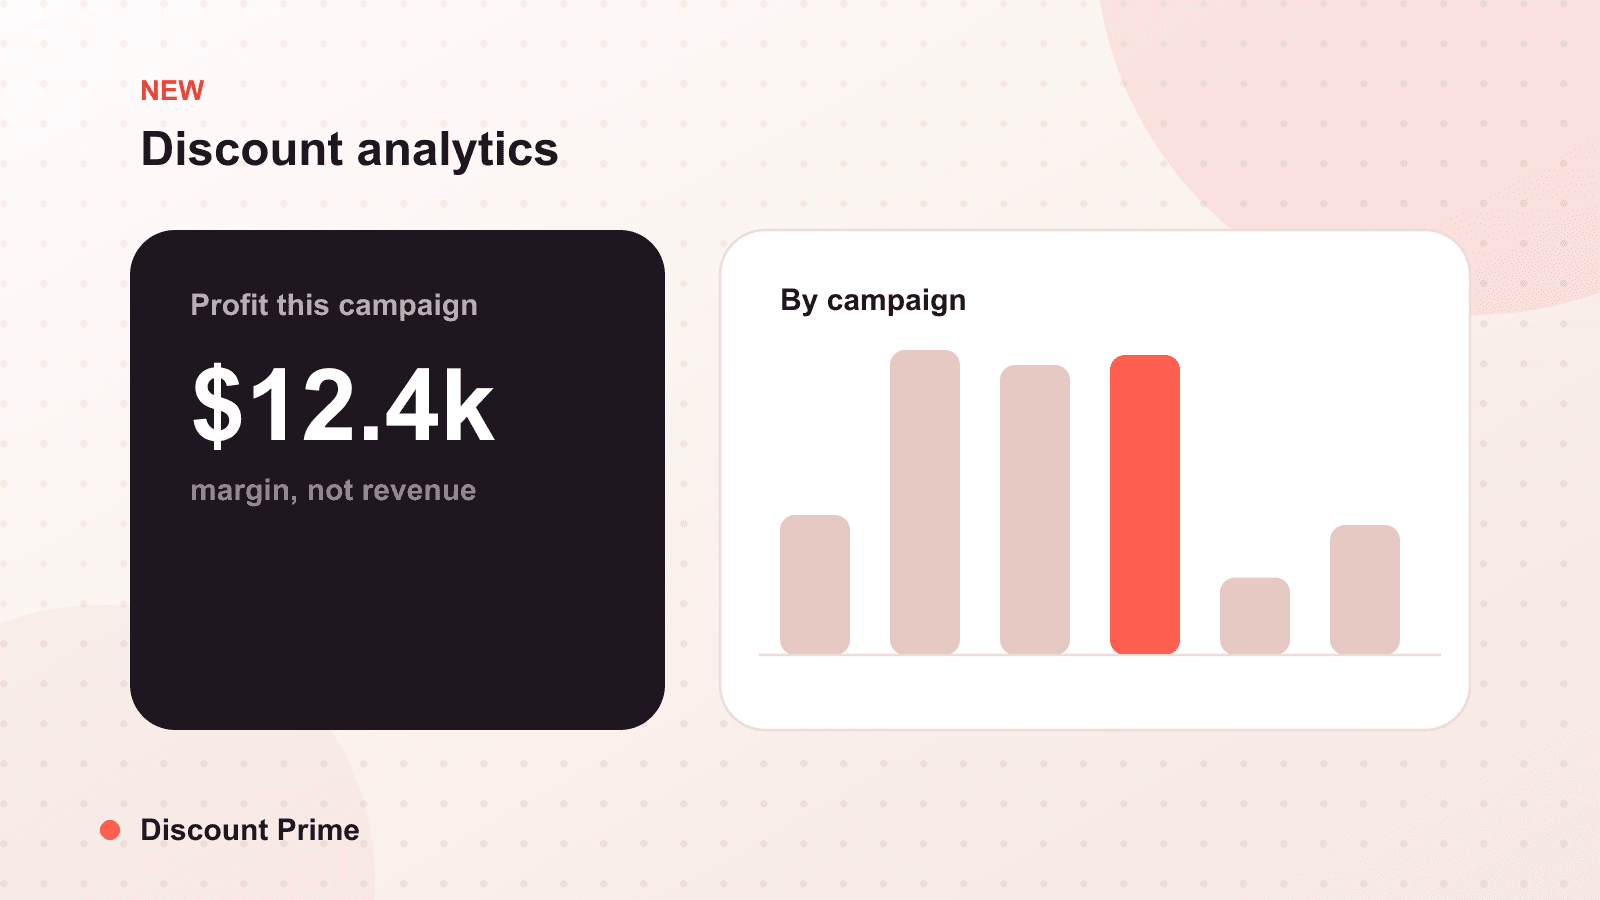
Today we are shipping discount analytics in Discount Prime. It answers the question every merchant should be able to answer and almost none can: which of your discounts are actually working? Not which ones got used, which ones changed behavior enough to be worth their cost. Orders driven, revenue, average order value, and redemption, broken out per discount, in one place.
This is our first analytics feature, and it is deliberately the foundation. Before you can optimize what a discount earns, you have to be able to see what each one does. That is what launches today.
The problem: discounting by instinct
Most stores decide which promotions to run based on a feeling. This one seemed popular. That one we always do. The BFCM code did fine last year, probably. None of that is measurement, and instinct hides two expensive failures.
The first is the idle discount: a code or automatic offer that barely gets used, cluttering your store and occasionally firing on an order in ways nobody planned. The second, more costly, is the demand discount: a promotion that gets used constantly but mostly applies to orders that would have happened anyway. It looks successful because redemption is high. It is actually just marking down sales you already had.
Without per-discount data, those two look identical to a busy operator, and you keep paying for both.
What discount analytics shows you
The release gives every discount its own performance view. The metrics that matter first:
- Orders driven. How many orders included this discount. The raw usage signal.
- Revenue. Total revenue on orders where the discount applied.
- Average order value. The AOV of discounted orders, which tells you whether an offer is growing baskets or just shaving existing ones.
- Redemption. How often the discount is being used relative to its exposure, the difference between an offer nobody finds and one that resonates.
Read together, these separate the discounts pulling their weight from the ones just occupying space. A volume tier that lifts AOV is doing its job. A code with heavy redemption but flat AOV is a candidate for a hard look.
A worked example: two offers that look the same
Suppose two active discounts each show 300 orders last month. On a usage dashboard they look equally successful. Discount analytics tells a different story.
| Offer A: 10% sitewide code | Offer B: buy 3, save 15% | |
|---|---|---|
| Orders driven | 300 | 300 |
| Average order value | $52 | $86 |
| AOV vs store baseline ($55) | Below baseline | Well above baseline |
| What it is doing | Marking down normal orders | Growing basket size |
Same order count, opposite economics. Offer A is discounting demand you already had, its discounted orders are smaller than a normal order. Offer B is changing behavior, pulling average order value well above your baseline. Before this data, both were "our popular discounts". After it, one is a keeper and one needs rethinking. That is the entire point of measuring.
Why we are shipping this now, six weeks before BFCM
The timing is not an accident. BFCM concentrates a full year of discounting into a single weekend, which means a promotion that quietly loses money does its maximum damage in November. Walking into that weekend with evidence about which offers actually drive orders, and which merely discount existing demand, is worth more than any last-minute tactic.
So use the next six weeks to look. Find the idle discounts and retire them. Find the demand discounts and either fix their structure or cut them. Keep the offers that provably grow orders and average order value, and make those your BFCM headliners. When you are ready to build the plan itself, our pre-BFCM checklist walks through the rest.
Where this is going
We want to be direct about what this release is and is not. Today it measures discount performance, orders, revenue, AOV, and redemption. That is the measurement foundation, and it is genuinely useful on its own. It is also the first step toward a longer ambition: reporting that puts profit, not just revenue, at the center of every discount decision. We are planting that flag now. This is the base we intend to build the profit-first story on top of.
For today, the win is concrete. You can finally see which discounts make you money and which just make noise.
Setting this up with Discount Prime
Discount analytics is live in our analytics for every Discount Prime store, no setup required beyond running discounts through the app. Pair it with volume discounts to see, in the data, which tiers actually lift average order value. If you are still deciding between automatic offers and codes, our guide on automatic discounts versus discount codes pairs well with the new numbers, and the BFCM 2024 discount playbook shows how to put them to work for the weekend.